
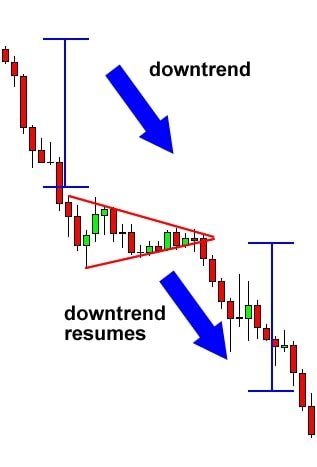
A bearish pennant is a technical chart pattern that typically signals a continuation of a downtrend. It forms during a consolidation phase after a sharp decline in price, suggesting that the prevailing bearish momentum is likely to resume once the pattern is completed.

What is the Bearish Pennant Pattern?
The Bullish Pennant pattern is a technical analysis pattern observed in the forex market. It is formed when there is a sharp upward price movement (flagpole) followed by a consolidation phase (pennant) that forms a triangle-shaped pattern. This pattern suggests that the market is taking a brief pause before continuing its uptrend. Traders often look for the Bullish Pennant pattern as a signal to enter a long position, anticipating that the price will continue to rise.
Structure of a Bearish Pennant:
Sharp Decline (Flagpole): The formation begins with a sharp downward movement in the price, often referred to as the “flagpole.” This sharp price movement sets the stage for the consolidation phase.
Consolidation (Pennant): After the decline, the price enters a period of consolidation, forming converging trendlines, with the price moving within a small range. These converging lines form the pennant shape, resembling a small symmetrical triangle. This phase reflects indecision among traders, but as the pattern progresses, the market is expected to break out in the direction of the prevailing trend (downward, in this case).
Breakdown: The bearish pennant is confirmed when the price breaks below the lower boundary of the pennant pattern, signaling that the downward trend is likely to continue. Volume typically increases at the breakout point, confirming the validity of the pattern.
Key Features:
Volume: Volume typically decreases during the consolidation phase and then spikes when the price breaks out of the pattern, either to the downside or upside (though in the case of a bearish pennant, it will be a downward breakout).
Duration: The pattern is typically short in duration, lasting from a few days to a few weeks, depending on the timeframe of the chart being analyzed.
Price Target:
Once the bearish pennant pattern is completed, traders often use the height of the initial flagpole (the sharp decline before the consolidation) to estimate a price target. This target is usually the same distance as the flagpole from the breakout point, extending downward.
Example of How to Trade a Bearish Pennant:
Identify the Pattern: Look for a strong downward price movement, followed by a period of consolidation where the price forms a small symmetrical triangle or a narrowing range.
Wait for the Breakout: Traders should wait for the price to break below the lower boundary of the pennant pattern. The breakout is the signal that the price is likely to continue downward.
Set a Target: Use the height of the flagpole to estimate the potential move after the breakout. This can be used to set a profit target or stop-loss level.
Risk Management: As with all technical patterns, risk management is key. Traders should always use stop-loss orders to limit potential losses, especially since price action can sometimes fail to follow the anticipated trend.
Bearish Pennant Pattern Strategy
Here’s a potential strategy for trading the Bullish Pennant pattern in the forex market:
- Identify the Bullish Pennant pattern: Look for a sharp upward price movement (flagpole) followed by a consolidation phase (pennant) that forms a triangle-shaped pattern.
- Confirm the pattern: Use technical indicators such as moving averages to confirm the pattern and ensure that the price is likely to continue its uptrend.
Sell Signal
Here’s an example of a sell signal for the Bullish Pennant pattern:
- Look for a sharp upward price movement (flagpole) in the forex market.
- Wait for a consolidation phase (pennant) to form a triangle-shaped pattern.
- Wait for the price to break below the lower trend line of the pennant, indicating a potential trend reversal.
- Enter a short position (sell) at the breakout point, which is the point where the price breaks below the lower trend line of the pennant.
How to Identify a Bearish Pennant:
- Initial Downward Move (Flagpole): Look for a sharp, steep price drop followed by a period of consolidation.
- Symmetrical Triangle: The consolidation phase forms a small, symmetrical triangle, where the price range tightens over time. The upper boundary typically slopes downward, and the lower boundary slopes upward.
- Volume Decrease: During the consolidation phase, the volume tends to decrease as the price moves within the narrow range.
- Volume Spike at Breakdown: When the price breaks below the lower trendline of the pennant, a volume spike often occurs, confirming the bearish continuation.
Trading the Bearish Pennant:
Confirmation of Breakdown: Wait for the price to break below the lower boundary of the pennant. This breakout signals the continuation of the downtrend.
Target Price: Traders often estimate a price target by measuring the height of the initial flagpole and projecting that distance downward from the breakout point. This gives a rough idea of how far the price could potentially move after the breakout.
Stop-Loss: It’s important to manage risk by setting a stop-loss order above the upper trendline of the pennant, in case the pattern fails and the price moves against the trader.
Example of the Bearish Pennant Pattern:
Imagine a stock that has been in a strong downtrend, and it suddenly drops sharply. After the decline, the price enters a period of consolidation where it fluctuates within a narrowing range, forming a symmetrical triangle. Traders then watch for the price to break below the lower boundary of this triangle. If the price breaks to the downside with increased volume, the stock is expected to continue its downward movement.
Bearish Pennant Pattern Pros & Cons
Pros
- Provides a clear visual signal of a potential continuation of an uptrend.
- Offers clear entry and exit points for traders to use when entering a trade.
Cons
- The pattern may be difficult to identify in a volatile market or during a period of low trading volume.
- Traders may have difficulty determining appropriate stop-loss and profit targets, leading to potential drawdowns or missed opportunities.
- The pattern may not work well in certain market conditions, such as during a market correction or significant news event.
Conclusion
In conclusion, the Bullish Pennant pattern is a technical analysis tool used by forex traders to identify potential continuation of an uptrend. The pattern provides a clear visual signal with well-defined entry and exit points, making it easy for traders to use in their trading strategies. However, it’s important to keep in mind that the pattern is not 100% reliable and may produce false signals, leading to potential drawdowns. Additionally, traders must use proper risk management techniques and carefully consider market conditions before making any trading decisions.

I’m a self-confessed Forex geek who spends countless hours researching, testing, and reviewing everything related to trading. With many years of experience in the Forex industry—and thousands of robots, brokers, strategies, and courses put to the test—I’ve seen what works and what doesn’t. My goal is simple: to share that knowledge with you for free, so you can navigate the exciting (and sometimes crazy) world of Forex trading with more confidence.


