
Day trading involves buying and selling financial instruments within the same trading day. To succeed in this fast-paced environment, traders often rely on technical analysis, which includes studying price charts to identify patterns that may predict future market movements. One of the most common tools used by traders is candlestick patterns. These patterns, derived from candlestick charts, provide valuable insights into market sentiment and potential price direction. In this article, we’ll explore various candlestick patterns used in day trading, their significance, and how they can be effectively applied to improve trading strategies.
Trade price action automatically with my Free Candlestick Pattern Expert Advisor (EA) for MT4 & MT5, built to detect and execute popular candlestick setups—like engulfing, pin bars, and doji reversals—directly on MetaTrader 4 and MetaTrader 5. Easy to install and fully customizable, it’s ideal for traders who want a clean, pattern-based automated strategy.
What are Candlestick Patterns?
Candlestick patterns are visual representations of price movements within a specific time period. Each candlestick consists of a body and two wicks (or shadows) on either side. The body represents the opening and closing prices for the period, while the wicks show the highest and lowest prices reached during that period. The most common time intervals for day traders range from one minute to one hour.
Candlestick patterns emerge when specific combinations of these candlesticks occur within a price chart. These patterns can be either bullish (indicating potential upward price movement) or bearish (indicating potential downward price movement). Some patterns also signal indecision or consolidation in the market.
Understanding these patterns and how they relate to market psychology is crucial for day traders. Let’s break down some of the most important candlestick patterns that can be applied to day trading.
Types of Candlestick Patterns
1. Single Candlestick Patterns
Single candlestick patterns are some of the most fundamental patterns that traders observe on a chart. These patterns represent a specific price action and can indicate market sentiment.
Doji Candlestick
The Doji is a single candlestick pattern where the open and close prices are very close, resulting in a small body and long wicks on either side. It signals indecision in the market, where buyers and sellers are in equilibrium. A Doji by itself doesn’t indicate a specific direction but suggests that the market may be ready to reverse or consolidate.
Hammer and Hanging Man
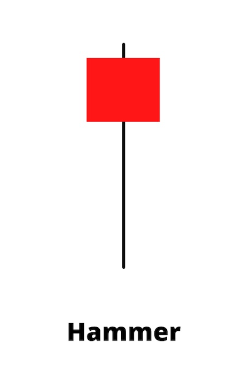
The Hammer and the Hanging Man have similar shapes, with a small body at the top of the candlestick and a long lower shadow. The difference between the two lies in their position within the trend.
- Hammer: Appears after a downtrend and signals a potential reversal to the upside.
- Hanging Man: Appears after an uptrend and signals a potential reversal to the downside.
Both patterns indicate a shift in market sentiment, with the long lower shadow suggesting that the sellers initially drove the price lower, but buyers regained control by the end of the period.
Engulfing Candlestick
The Engulfing pattern occurs when a larger candlestick completely engulfs the body of the previous smaller candlestick. This pattern indicates a strong shift in market sentiment and can be bullish or bearish:
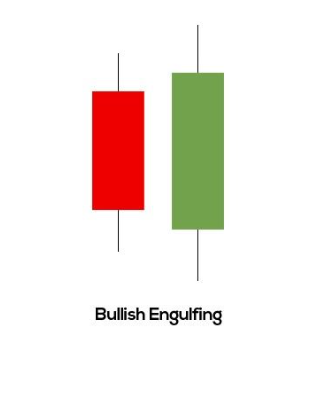
- Bullish Engulfing: A small bearish candle followed by a larger bullish candle. This pattern suggests that buyers have taken control and the price may rise.
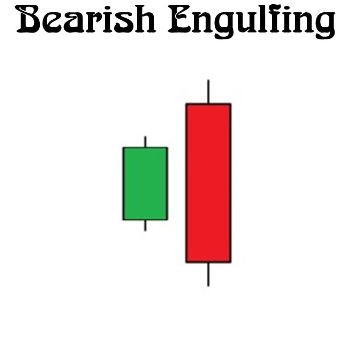
- Bearish Engulfing: A small bullish candle followed by a larger bearish candle. This pattern suggests that sellers have gained control, and the price may fall.
2. Double Candlestick Patterns
Double candlestick patterns occur when two candles form a specific configuration, signaling a potential trend reversal or continuation. These patterns are more reliable than single candlestick patterns.
Morning Star and Evening Star
The Morning Star and Evening Star are three-candle patterns that occur after a trend, signaling a reversal.
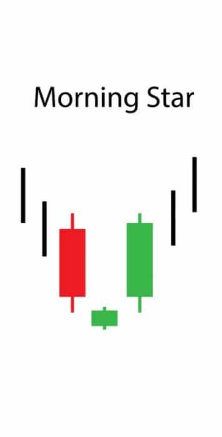
- Morning Star: This pattern appears after a downtrend and consists of three candles: a large bearish candle, a small-bodied candle (usually a Doji), and a large bullish candle. The Morning Star suggests a reversal to the upside.
- Evening Star: This pattern appears after an uptrend and consists of a large bullish candle, a small-bodied candle, and a large bearish candle. The Evening Star suggests a reversal to the downside.
Both patterns indicate that the market is losing momentum, and the trend may be about to reverse.
Bullish and Bearish Harami
The Harami pattern consists of two candles where the second candle’s body is completely contained within the body of the first candle. It’s a signal of potential trend reversal, depending on whether the pattern appears after an uptrend or downtrend.
- Bullish Harami: A small bullish candle within a larger bearish candle, indicating that selling pressure is weakening and buyers might take control.
- Bearish Harami: A small bearish candle within a larger bullish candle, indicating that buying pressure is weakening and sellers might take control.
3. Triple Candlestick Patterns
Triple candlestick patterns involve three consecutive candles and tend to be more reliable indicators of market movement. These patterns can signal strong trend reversals or confirmations.
Three White Soldiers and Three Black Crows
The Three White Soldiers and Three Black Crows are powerful reversal patterns that appear after a prolonged trend.
- Three White Soldiers: This pattern consists of three consecutive long bullish candles, each closing higher than the previous one. It signals strong upward momentum and a potential bullish reversal after a downtrend.
- Three Black Crows: This pattern consists of three consecutive long bearish candles, each closing lower than the previous one. It signals strong downward momentum and a potential bearish reversal after an uptrend.
Both patterns are considered highly reliable in predicting price direction when they form in the right context.
The Three Inside Up and Three Inside Down
The Three Inside Up and Three Inside Down patterns are used to confirm trend reversals after a period of consolidation or pullback.
- Three Inside Up: This pattern consists of a small bearish candle, followed by a larger bullish candle that fully engulfs the previous one, and another bullish candle. It signals a continuation of the uptrend.
- Three Inside Down: This pattern consists of a small bullish candle, followed by a larger bearish candle that fully engulfs the previous one, and another bearish candle. It signals a continuation of the downtrend.
How to Use Candlestick Patterns in Day Trading
While candlestick patterns are powerful tools for identifying potential price movements, they should not be used in isolation. Successful day trading involves combining candlestick patterns with other technical indicators and tools to confirm signals and manage risk.
1. Combine Candlestick Patterns with Support and Resistance
Support and resistance levels are essential for day traders to identify key price levels where the market might reverse or consolidate. Candlestick patterns occurring near these levels can be more reliable. For example, a Bullish Engulfing pattern near a support level could indicate a strong buying opportunity.
2. Use Technical Indicators
Indicators such as Moving Averages (MA), Relative Strength Index (RSI), and Bollinger Bands can be used alongside candlestick patterns to confirm signals. For instance, if a Doji pattern forms and the RSI is in oversold territory, this might suggest a buying opportunity, as the price could be poised to reverse.
3. Manage Risk
Day trading involves significant risk, so it’s important to use candlestick patterns alongside proper risk management strategies. Setting stop-loss orders, using position sizing techniques, and having a clear exit strategy are essential for preserving capital and maximizing profits.
4. Consider Market Context
Candlestick patterns should be interpreted in the context of the broader market trend. A reversal pattern in a strong trend might be less reliable than a continuation pattern. Additionally, market news and events can impact the effectiveness of certain candlestick patterns.
Bullish Candlestick Patterns
Hammer
This pattern appears at the end of a downtrend, indicating a potential trend reversal. It has a small body and a long lower wick, resembling a hammer. The presence of a hammer pattern suggests that buyers are stepping in, potentially leading to an upward move.
Bullish Engulfing
This pattern occurs when a small bearish candlestick is followed by a larger bullish candlestick that completely engulfs the previous one. The bullish engulfing pattern suggests a shift in market sentiment from bearish to bullish, indicating potential buying opportunities.
Morning Star
The morning star pattern consists of three candlesticks: a large bearish candlestick, followed by a small candlestick with a smaller body, and finally a large bullish candlestick. It signifies a reversal of a downtrend, indicating that buyers are gaining control.
Bearish Candlestick Patterns
Shooting Star
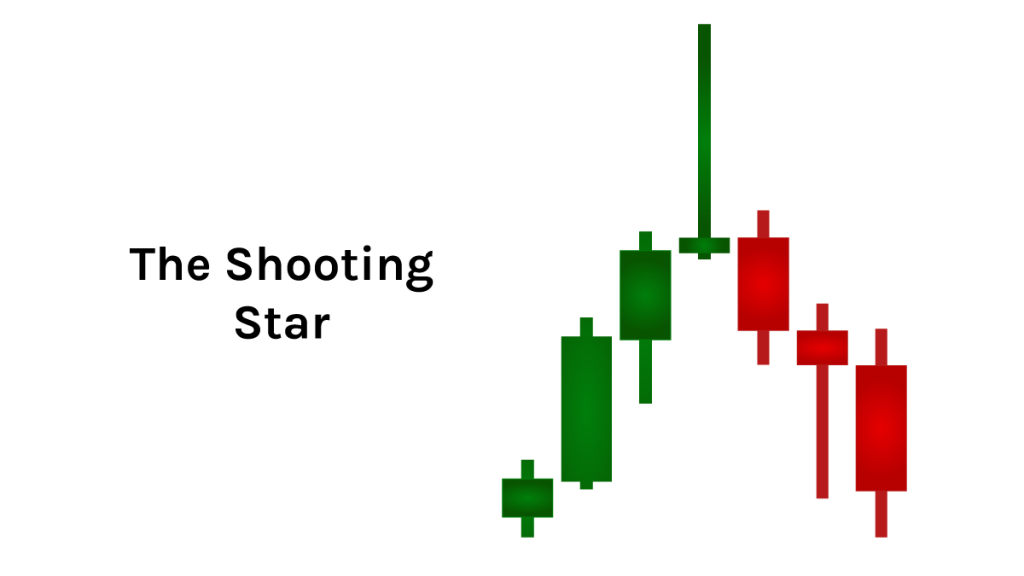
This pattern appears at the end of an uptrend and indicates a potential reversal. It has a small body and a long upper wick, resembling a shooting star. The shooting star pattern suggests that sellers are entering the market, potentially leading to a downward move.
Bearish Engulfing
Similar to its bullish counterpart, the bearish engulfing pattern occurs when a small bullish candlestick is followed by a larger bearish candlestick that engulfs the previous one. It suggests a shift in market sentiment from bullish to bearish, indicating potential selling opportunities.
Evening Star
The evening star pattern is the opposite of the morning star. It consists of three candlesticks: a large bullish candlestick, followed by a small candlestick with a smaller body, and finally a large bearish candlestick. It signifies a reversal of an uptrend, indicating that sellers are gaining control.

Incorporating Candlestick Patterns in Day Trading
- Confirmation: While candlestick patterns provide valuable insights, it is essential to confirm their validity with other technical indicators or tools such as trend lines, moving averages, or volume analysis.
- Timeframes: Candlestick patterns can be analyzed across various timeframes, from minutes to hours and days. Traders should select timeframes that align with their trading strategy and goals.
- Risk Management: Effective risk management is crucial in day trading. Traders should set stop-loss orders to limit potential losses and employ proper position sizing to manage risk effectively.
Conclusion
Candlestick patterns play a significant role in day trading strategies, providing valuable insights into market sentiment and potential price reversals. Traders who master the interpretation and implementation of these patterns can gain a competitive edge in the fast-paced world of day trading. Remember, while candlestick patterns offer valuable information, it is essential to complement their analysis with other technical tools and maintain disciplined risk management practices. With continuous learning and practice, traders can harness the power of candlestick patterns to make informed trading decisions.

I’m a self-confessed Forex geek who spends countless hours researching, testing, and reviewing everything related to trading. With many years of experience in the Forex industry—and thousands of robots, brokers, strategies, and courses put to the test—I’ve seen what works and what doesn’t. My goal is simple: to share that knowledge with you for free, so you can navigate the exciting (and sometimes crazy) world of Forex trading with more confidence.


