
The descending triangle pattern is a commonly used technical analysis tool in the world of Forex trading. This pattern is formed when the price of an asset creates a series of lower highs and a horizontal support level. As the support level is tested multiple times, the buyers become weaker, and eventually, the price breaks below the support level, leading to a bearish reversal.
In this article, we will discuss the descending triangle pattern in detail, including how to identify it, its characteristics, and its potential uses in Forex trading.
Identifying the Descending Triangle Pattern
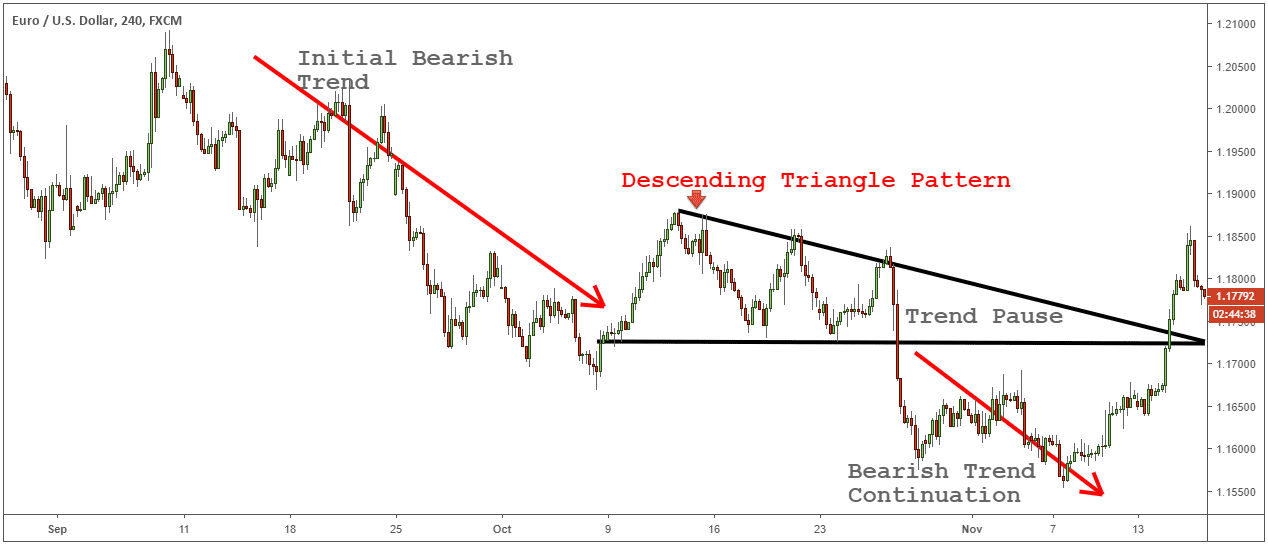
The descending triangle pattern is a bearish continuation pattern that is formed when the price of an asset creates a series of lower highs and a horizontal support level. This pattern can be identified on a price chart by drawing a trendline connecting the lower highs and a horizontal support line connecting the lows. The pattern is confirmed when the price breaks below the support level, indicating that the bearish trend is likely to continue.
Characteristics of the Descending Triangle Pattern
The descending triangle pattern is characterized by a series of lower highs and a horizontal support level. The support level is formed by the buyers who are willing to buy the asset at a certain price. As the price continues to test this level, the buyers become weaker, and eventually, the price breaks below the support level. This indicates that the bearish trend is likely to continue, and traders can use this information to take a short position in the asset.
The descending triangle pattern can occur on any timeframe and can be found in any market, including the Forex market. The pattern is usually formed during a downtrend, indicating that the bears are in control of the market. However, it is essential to note that the descending triangle pattern can also occur during an uptrend, indicating that the bulls are losing momentum and that a bearish reversal is likely to occur.
Trading the Descending Triangle Pattern
Trading the descending triangle pattern involves taking a short position in the asset after the price breaks below the support level. Traders can use a stop-loss order to limit their losses if the price moves against their position. The stop-loss order should be placed above the support level, ensuring that the trade is closed if the price breaks back above the support level.
The profit target for the trade can be determined by measuring the distance between the highest high and the support level and projecting it below the support level. This gives traders an idea of how much profit they can expect from the trade if the price moves in their favor.
Traders can also use other technical analysis tools, such as moving averages and oscillators, to confirm the bearish trend and increase their chances of making a profitable trade.
Risks and Limitations of Trading the Descending Triangle Pattern
Although the descending triangle pattern is a powerful tool for Forex traders, it is essential to note that it is not foolproof. Like any other technical analysis tool, the pattern can produce false signals, leading to losses. Traders should always use other technical analysis tools to confirm the pattern and increase their chances of making a profitable trade.
Additionally, the descending triangle pattern can be challenging to identify, especially for novice traders. It requires a good understanding of technical analysis and the ability to read price charts accurately. Traders should take the time to study the pattern and practice identifying it on historical price charts before using it in live trading.
Conclusion
The descending triangle pattern is a commonly used technical analysis tool in Forex trading. It is a triangle candlestick pattern that is formed when the price of an asset creates a series of lower highs and a horizontal support level, indicating that the bears are in control of the market. Traders can use this information to take a short position in the asset after the price breaks below the support level.
Trading the descending triangle pattern requires a good understanding of technical analysis and the ability to read price charts accurately.

I’m a self-confessed Forex geek who spends countless hours researching, testing, and reviewing everything related to trading. With many years of experience in the Forex industry—and thousands of robots, brokers, strategies, and courses put to the test—I’ve seen what works and what doesn’t. My goal is simple: to share that knowledge with you for free, so you can navigate the exciting (and sometimes crazy) world of Forex trading with more confidence.


